The planning phase is to understand why the system should be built and determine how project team should build it. The deliverable of the planning phase is the project plan.
Project initialisation
During the project initialisation, the system’s business value to the organisation is identified: How it will lower the cost and increase revenues. Most ideas for new system come from outside of the system area (e.g. marketing department, accounting department) in the form of a system request. A system request is a document that describes the business reasons for building a system and the value that the system is expected to provide. The information system department works together with the person or department that generated the request (called the project sponsor) to conduct the feasibility analysis.
Feasibility analysis
The feasibility analysis examines key aspects of the proposed project:
- The idea’s technical feasibility (Can we build it?)
- The economic feasibility (Will it provide business value?)
- The organisational feasibility (If we build it, will it be used?)
The system request and feasibility analysis are presented to an information system approval committee (sometimes called a steering committee), which decides whether the project should be undertaken.
Develop work plan
Once the project is approved, it enters project management. During project management, the project manager creates a workplan, staffs the project, and puts techniques in place to help the project team control and direct the project throughout the entire SDLC. The deliverable for the project management is a project plan, which describes how the project team will go about developing the system. The work plan has several forms:
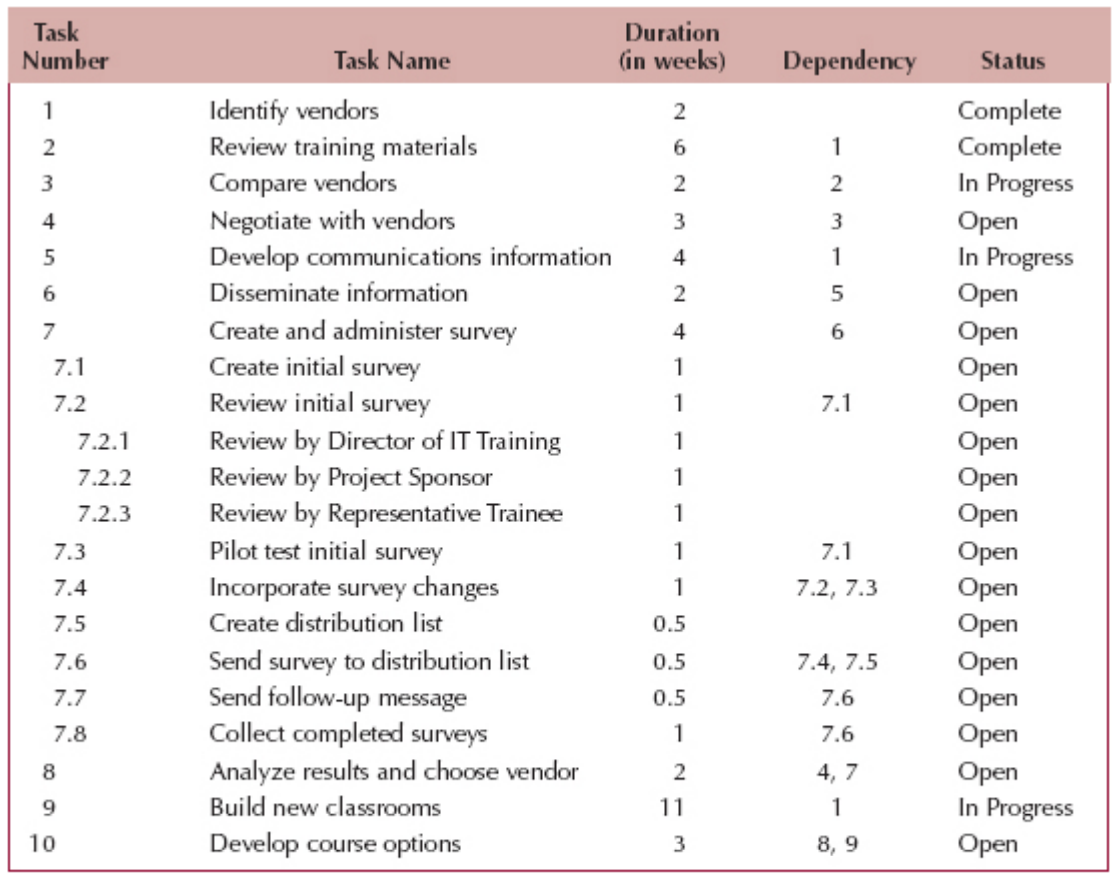
- Work Breakdown Structure (WBS)
High-level tasks are first defined and then broken down into sub-tasks
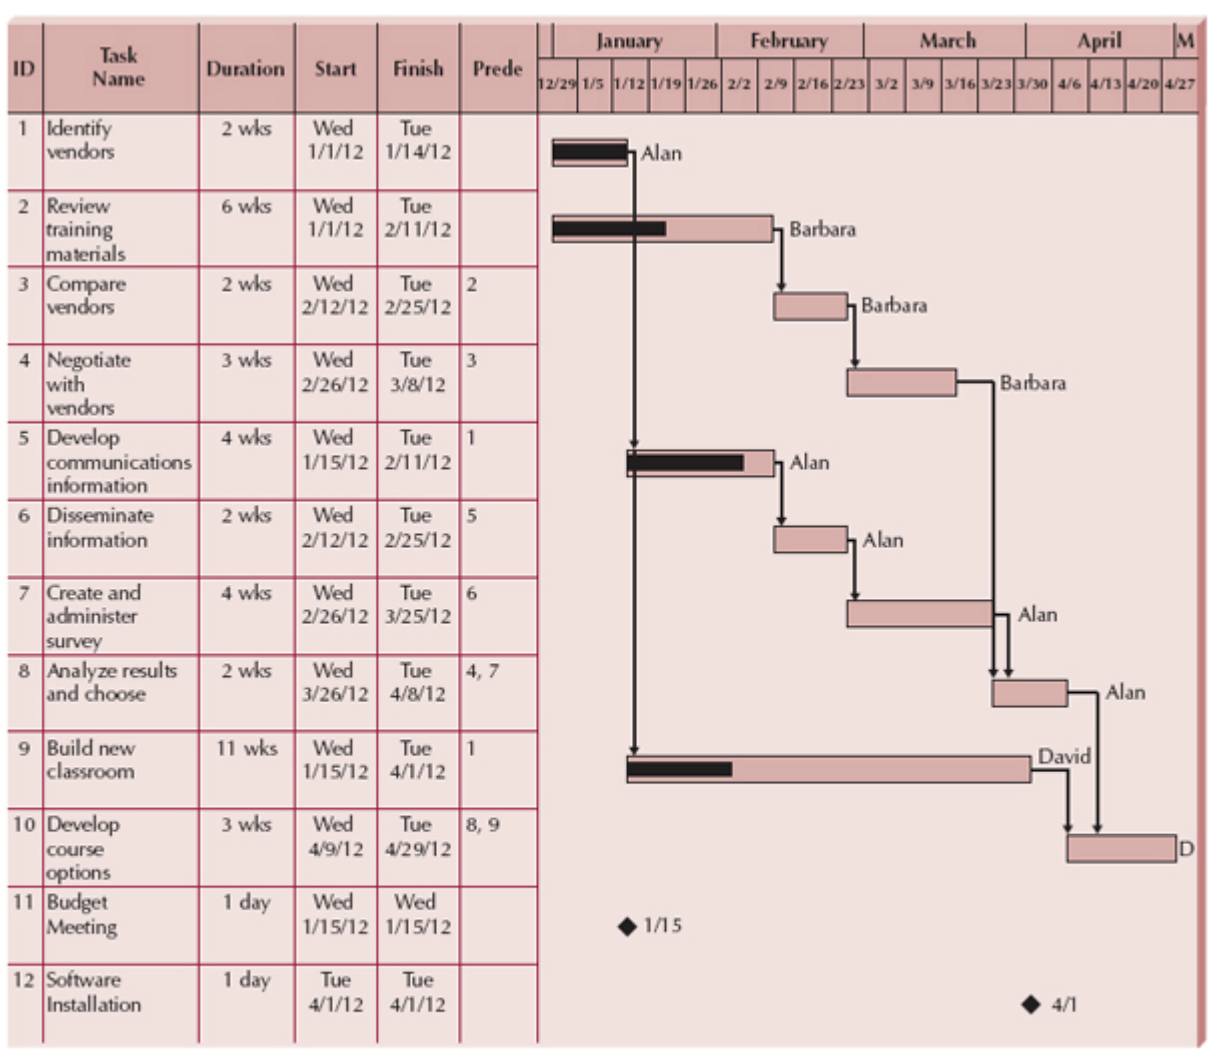
- Gantt chart
A gantt chart is a horizontal bar chart that shows the same task information as the project WBS but in a graphical way. Tasks are listed as rows in the chart, and time is listed across the top in increment based on the needs of the project.
- Network diagram A second graphical way to look at project workplan information is the network diagram that lays out the project tasks in a flowchart. The network diagram is drawn as a node-and-arc type of graph that shows time estimates in the nodes and task dependencies on the arcs.
Back to parent page: Software Development Life Cycle (SDLC)